Category
Data Visualization
1

Datastory
Turn the world's data into stories worth sharing
Artificial IntelligenceData & Analytics
56
Notable2

Datastripes Data Stories
Turn any spreadsheet into a data story in seconds
Data & AnalyticsData Visualization
55
Notable3

Reactor Atlas
Every nuclear reactor on Earth, mapped since 1954
OpenAI DayEducation
58
Notable4

Museum of Models
Every answer 371 AI models gave to the same questions
Artificial IntelligenceData Visualization
54
Notable5

Dashrendr
Build dashboards visually, embed them anywhere
Google Cloud RunSaaS
56
Notable6

Earth Stats
Live planet statistics on a 3D globe, one number at a time
EducationClimate Tech
53
Notable7

Globenomics
Explore 3D globe, 16 games, and 195 countries up for auction
EducationGames
38
Early8

GISCARTA
Build interactive web maps and dashboards by asking AI
MapsClimate Tech
36
Early9

OrcaSheets AI Dashboards
Talk to your data and get live dashboards you can share
SpreadsheetsData & Analytics
31
Early10

Color Studio — OKLCH palette tool
A tool for creating balanced palettes for UI & visualization
ColoringData Visualization
34
Early11

Graphene
The everything-as-code analytics platform built for agents
GitHubData Science
30
Early12

Cinegraph
From spreadsheet to cinematic 3D data story
Artificial IntelligenceDesign Tools
29
Early13

Veggie Bestie
A tiny Apple Watch habit tracker that grows a story
Apple WatchProductivity
29
Early14

Nosso Imposto
Brazil's public records, finally in the same room
MapsPolitics
28
Early15

Analisa US
Every US county on one map, every number with its source
MapsPolitics
25
Early16

MoverMath
Compare 299 metrics across every U.S. state and county
Moving & StorageOpenAI Day
23
Early17

WordCanvas3D
See how AI reads text: tokens, embeddings and vector math
EducationArtificial Intelligence
23
Early18

AI PM Knowledge Graph by AllthingsPM
Every AI product concept and how they connect, as a 3D sky
EducationArtificial Intelligence
23
Early19

COREY
Check and fix IFC model data *visually* in your browser
OpenAI DayGitHub
20
Quiet20

PartLens
PartLens - Understand every part of your machine
SaaSGitHub
20
Quiet21

DonorAlpha
Follow the money in every federal election
NewsPolitics
20
Quiet22

Bravery Watch
Find a watch that fits your wrist, from 2,400+ models
ShoppingFashion
20
Quiet23

v<ticker>
Video Model Prices Tracked. Updated Daily.
Artificial IntelligenceData Visualization
20
Quiet24

Chartory
100 free React chart types, now in the shadcn directory
Developer ToolsDesign Tools
20
Quiet25

Chess Visualizer
#chess #visualization #education #boardgames
GitHubGames
17
Quiet26

World Cinema Atlas
Films and series, mapped to where their stories happen
MoviesMaps
17
Quiet27

Diamond Watcher - Diamond Price Index
Track natural and lab-grown diamond prices across retailers
Data & AnalyticsShopping
18
Quiet28
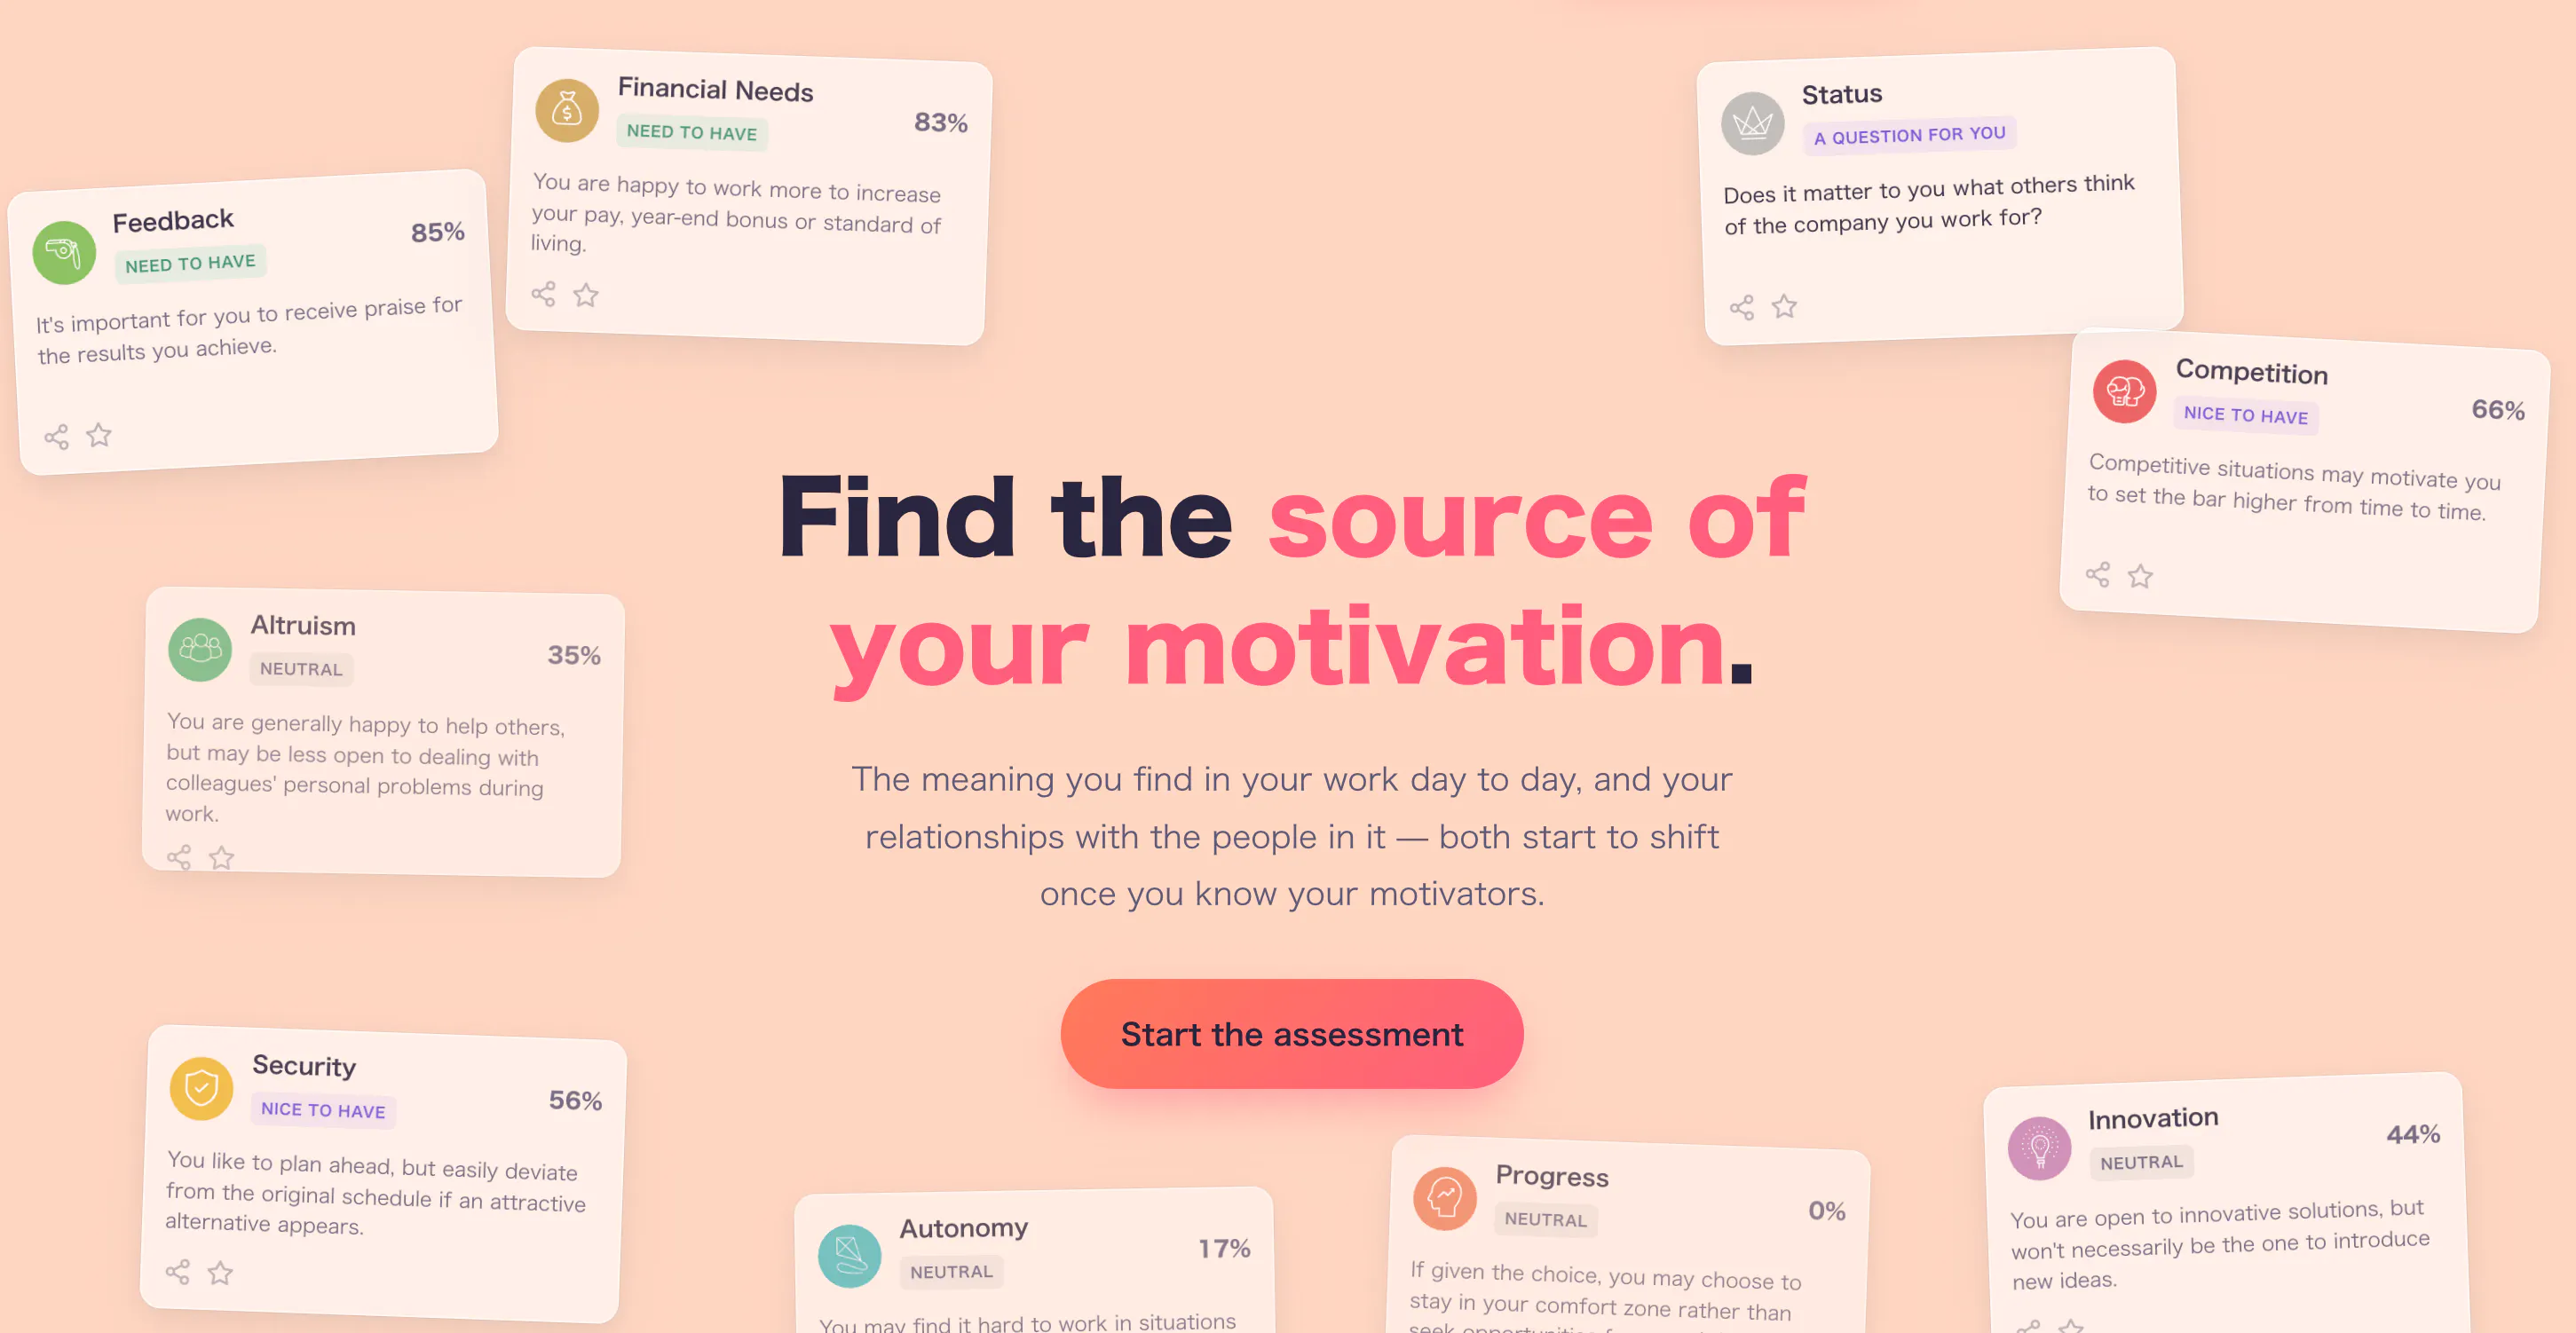
MotiTune
Your Intrinsic Motivation
Quantified SelfHuman Resources
17
Quiet29

Rhubarb
Build custom interactive data visualizations with AI
Artificial IntelligenceData & Analytics
20
Quiet30

Birthday Traffic
How rare is your birthday? Rank it against 85.7M others
OpenAI DayWeb App
17
Quiet31

World Explorer
3D World Map & Location Guesser Game
GitHubMaps
18
Quiet32

Galacius
A native desktop dashboard for Kubernetes
Developer ToolsData Visualization
17
Quiet33

FigSchema
A visual database schema (ERD) designer for Figma
Developer ToolsDatabase
17
Quiet34

Tayf — Music Visualizer
Turn whatever your computer plays into living visuals.
MusicData Visualization
17
Quiet35

AverraTriumph
One platform for portfolio insights and global access
AnalyticsData Visualization
17
Quiet36

Markdown Visual
A fast, local-first Markdown viewer and editor
ProductivityData
18
Quiet37

PlotStudio AI
Agentic data analysis for researchers
Artificial IntelligenceData & Analytics
18
Quiet38

DataCleanist
80% of ML is data cleaning. We do that part.
Developer ToolsArtificial Intelligence
20
Quiet39

ATARS
by the student for every learner
Data & AnalyticsData Science
18
Quiet40

Listen — Music Map & Stats
Your Apple Music as a world map, charts and stats
MusicData Visualization
17
Quiet41

modelsentiment
Which AI model does Reddit actually like?
Artificial IntelligenceData & Analytics
17
Quiet42

DataInsight Pro
Free Online Data Analysis, Cleaning & Visualization
AnalyticsData & Analytics
17
Quiet43

ValoPeek
Free VALORANT map stats, K/D tracker and map callouts
First Person ShooterData & Analytics
17
Quiet44

NextStop.city
Drop into a random city’s streets and catch the local vibe.
TravelEntertainment
20
Quiet45

DataScope
Explore Japanese and global statistics with clear sources
AnalyticsData Visualization
17
Quiet46

SeeTheScale
See how big numbers really are
EducationArtificial Intelligence
17
Quiet47

Portsviews
The ships off your coast, live on your wall
GitHubMaps
17
Quiet48

Isochrone.ch
Explore public transport accessibility in Switzerland
TransportationMaps
17
Quiet49

Billion Ballots
Indian election analysis and forecast builder
MapsPolitics
18
Quiet50

ChartMaker
Free Online Chart & Graph Maker
EducationDesign Tools
17
Quiet